In this first part of a multi-part series, we'll go through a general overview, installation, feature highlights, and several visual examples of using UCSF Chimera for protein visualization.
Molecular visualization
Molecular visualization and analysis of structural features are essential prerequisites in the understanding 3D structure of proteins, peptides, and nucleotides. The design of molecular complexes of the above biopolymers with small molecules or peptides (e.g., inhibitors) becomes significantly enabled with proper and helpful tools. Such tools and methods thus form an essential part of the structure-based drug design (SBDD).
While there are several excellent molecular visualization packages, this blog will focus on one such package - UCSF Chimera (Pettersen et al. (2004); Goddard and Ferrin (2007)).
However, in the interest of fairness, I'll briefly mention other packages:
- PyMOL 1 and its maintained open-source version 2 (*)
- VMD 3
- Biovia Discovery Studio 4
- Jmol 5
Since the PyMOL is one of the top molecular visualization tools used in drug discovery, here are several links to resources that describe (more complex) installation of the latest open-source PyMOL on Windows:
- Legacy source and binaries
- Unofficial Windows binaries and how to install them a) and b)
- Install Pymol v2+ under Python Conda environment
Chimera
Now, back to the heart of the topic, the UCSF Chimera - a feature-rich desktop application for interactive visual analysis. Chimera has been developed by the Resource for Biocomputing, Visualization, and Informatics (RBVI) at the University of California, San Francisco (UCSF). Since a picture is worth a thousand words, I included several screenshots taken from Chimera's main graphical user interface (GUI). All visualizations were generated on Windows 10.
Let's start with a little more advanced representation of contact surfaces between two proteins, in this case, the SARS-CoV2 and ACE2 (Fig. 1). Image details like labels, colors, and rendering are fully customizable through scripts.
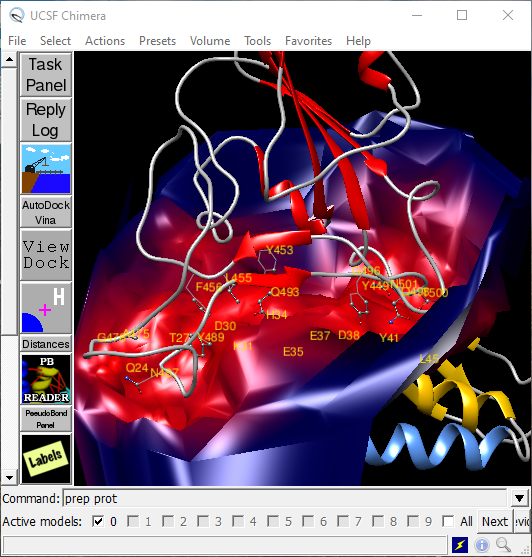
Fig. 1. An example of Chimera user interface. The image details the contact surface for an interaction between RBD of SARS-CoV2 and ACE2 (ribbon helices \(\alpha\)1 and \(\alpha\)2 in gold and blue, respectively.
Features
Many features of the Chimera, such as direct access to PDB, EMDB, NBD, PubChem3D, and UniProt, are enabled by internet-based services.
Examples of analytical services include BLAST Protein, Clustal Omega, MUSCLE, SMILES Translator, or smi23d. The full list of web services utilized by Chimera is maintained at this link. Interfaces to multiple sequence alignment (MSA) using Clustal omega or MUSCLE are now part of the Chimera package (Huang et al. (2014)). Additional services include BLAST sequence searching (Altschul et al. (1990)), Modeller comparative modeling (Webb and Sali (2016), Yang et al. (2012)), calculation of small-angle X-ray scattering profiles (SchneidmanDuhovny et al. (2010)), APBS electrostatic calculations (Unni et al. (2011)), PDB2PQR preparation of structures for calculations involving electrostatics (Unni et al. (2011), Dolinsky et al. (2007)), and AutoDock Vina molecular docking (Trott and Olson (2010)).
Figure 2 illustrates many feature-rich menu items accessible from the top section of the Chimera's GUI. On the Volume menu, the frequently used modules include Volume Viewer, Surface Color, and Measure Volume and Area.
The Tools menu offers a rich and expandable selection of multiple modules and panels.
General Controls menu offers several frequently used items, such as:
- Command Line (at the bottom in Fig. 1 allowing to instruct Chimera by commands)
- Model Panel (an integrated view on opened models with shortcuts to model-modifying commands)
- Keyboard Shortcuts (enabling to modify rendering properties quickly. Activate in Command Line as Command: ac)
Depiction menu features items, such as:
- Color Secondary Structure (with customizable colors for helices and turns)
- PipesAndPlanks (an alternative to ribbons view)
- 2D labels (useful for annotation)
- Surface Capping
- Per-Model Clipping (see Fig. 4)
The Surface/Binding Analysis sub-menu has several groups of modules used in structural analysis and molecular docking (Fig. 2). The latter group features modules that allow the preparation of proteins and ligands for docking with AutoDock Vina (an open-source program that must be installed separately). Results can then be viewed and analyzed in the ViewDock module.
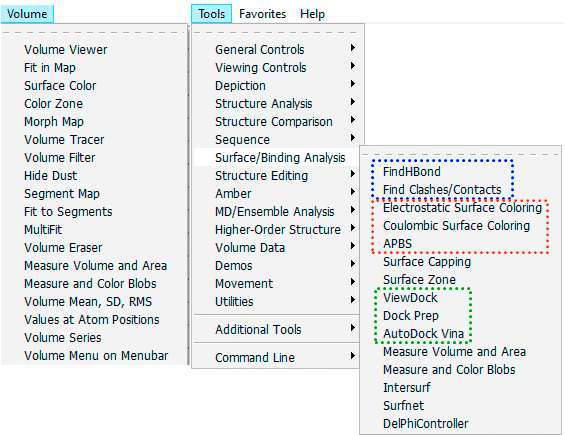
Fig. 2. An example of feature-rich options and modules accessible from the main menu of the UCSF Chimera.
With extensive support for rendering molecular surfaces and volumes, bonds and atoms, structure minimization, analysis of molecular dynamics trajectories, and scripting capabilities, the Chimera is a tool of choice for structure-based protein and drug design.
How does it compare with PyMOL Viewer? There certainly is a steep learning curve when mastering Chimera. But in the end, Chimera has a broader scope, has more built-in modules, and due to the GUI menus, feels more comprehensive. I also use PyMOL in my work and think that in some cases it renders proteins slightly better. For obvious reasons, it is visually closer to rendering in the Schrödinger suite, particularly the Maestro module.
Chimera's primary programming language is Python, namely Python 2. By software architecture, Chimera is divided into core and extensions. The core provides basic services and visualization capabilities. All higher-level functionality is provided through extensions (plugins).
In another example, the binding pocket of HEME ligand is shown interacting with a bound molecule of oxygen in complex with oxymyoglobin.
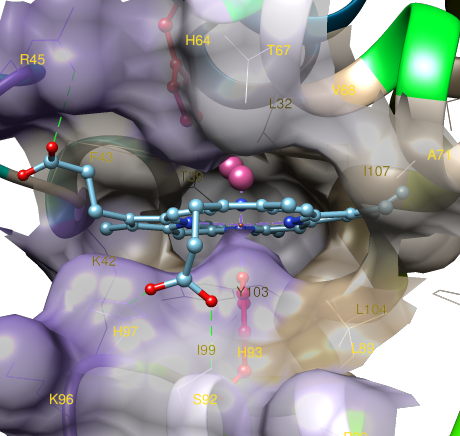
Fig. 3. Details of ligand (HEME) binding surface in the hydrophobic pocket of oxymyoglobin (PDB code 1MBO).
Licensing
The UCSF Chimera is available from http://www.cgl.ucsf.edu/chimera/.
It can be downloaded free of charge for academic, government, non-profit, and personal use. It can be licensed by commercial institutions for a fee. Extensions to Chimera developed by outside researchers can be redistributed freely.
If publishing results obtained with Chimera, include an appropriate citation as described at: http://www.cgl.ucsf.edu/chimera/docs/credits.html.
Installation
Since my main systems include Windows 10 and Linux Mint, I'll detail the installation on those systems. For installation instructions on Mac OS X 10.8 or later, follow this link.
Windows 10:
- Download Chimera distribution file from here to a place like the
Downloadsfolder, in this example, filechimera-1.14-win64.exe. - In the
Downloadsfolder, double-click the downloaded binary and follow installation instructions. - Keep or change the drive ("C:", "D:", "E:", ...). Chimera should then be installed in
drive:\Program Files\Chimera 1.14 - Keep all the recommended selections during the install (e.g., Add icon to the Desktop, Precompile Python modules). The latter task may take about a minute to complete.
- Add Chimera to the Path in the
User variable for {USER}section, where {USER} will be your Windows account name. In theStartmenu at the bottom search field (Search programs and files) copy/paste the following command and press enter:
>rundll32.exe sysdm.cpl,EditEnvironmentVariables
Alternatively, use the Windows native shell (cmd.exe) and copy/paste into it the same commands.
Click New or Browse and locate the Path for the Chimera executable (\bin) folder.

- Double-click the Chimera icon on your Desktop and head to
Help->Registration...section to register your copy. By providing the information requested in the short form you will be helping to document the impact this software is having in the scientific community.
Linux:
- Download Chimera distribution file from here to a place like ~/Downloads folder, in this example, file
chimera-1.14-linux_x86_64.bin.
$ cd ~/Downloads
$ chmod +x chimera-1.14-linux_x86_64.bin
$ sudo ./chimera-1.14-linux_x86_64.bin

# or in one line (set attributes and run)
$ chmod +x chimera-*.bin && ./chimera-*.bin
- Follow the interactive install instructions:
Enter install location: /opt/UCSF/Chimera64-1.14 'enter'
Install desktop menu (icon has to be done by user)? 'yes'

Install symbolic link to chimera executable for command line use in which directory?
       0 -- no link
       1 -- /usr/local/sbin
       2 -- /usr/local/bin
       3 -- /usr/sbin
       4 -- /usr/bin
       5 -- /sbin
       6 -- /bin
       7 -- /snap/bin
[hit Enter for default (0)]: '2'

Create unversioned link to chimera executable in same directory? 'yes'
(now installing)
- To place Chimera icon on the user desktop, run the command below:
To (re)install desktop menu and icon later, run:
'/opt/UCSF/Chimera64-1.14/bin/xdg-setup install'
On my Linux Mint 19.1 Tessa (MATE), the app was placed into Menu->Graphics
- From the terminal, check that Chimera was correctly installed by:
$ chimera --version
'chimera production version 1.14 (build 42094) 2019-11-13 06:05:13 UTC'

$ which chimera
'/usr/local/bin/chimera'
- To make sure that Chimera can be called from anywhere on your system, add the following two lines to your
.bashrcfile:
# CHIMERA
export PATH=$PATH:$HOME/usr/local/bin/chimera
Now, there should be the Chimera icon ![]() on your system desktop. Double-click it to start the application. Alternatively, in your terminal, type:
on your system desktop. Double-click it to start the application. Alternatively, in your terminal, type:
$ chimera
See the more detailed description of the Linux installation.
- Same as in the Windows installation section, register your copy of Chimera to further support its maintenance and development.
More examples of surfaces
Besides the extensive rendering capability of proteins and DNA chains, options in the Volume menu allow for the generation of molecular surfaces, such as calculated electron density, mapping of electrostatic potential onto the electron density (Fig. 4), display of molecular orbitals or electron localization function (Fig. 5). The basis for such surface display is cube files generated by many quantum mechanics packages (in this case by the open-source package PSI4 and Dgrid).
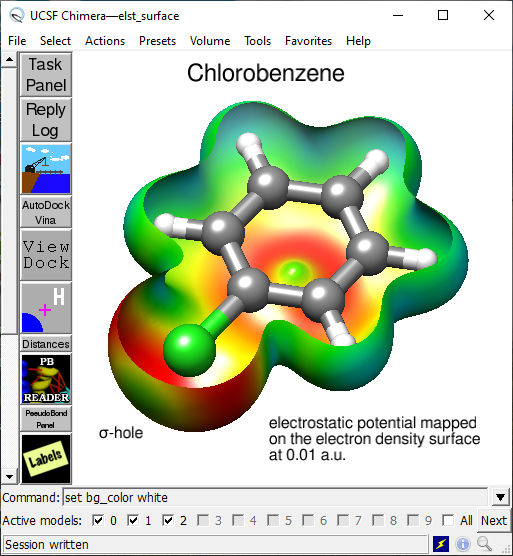
Fig. 4. Molecule of chlorobenzene with a slice through the surface generated by mapping electrostatic potential onto electron density at 0.01 a.u.
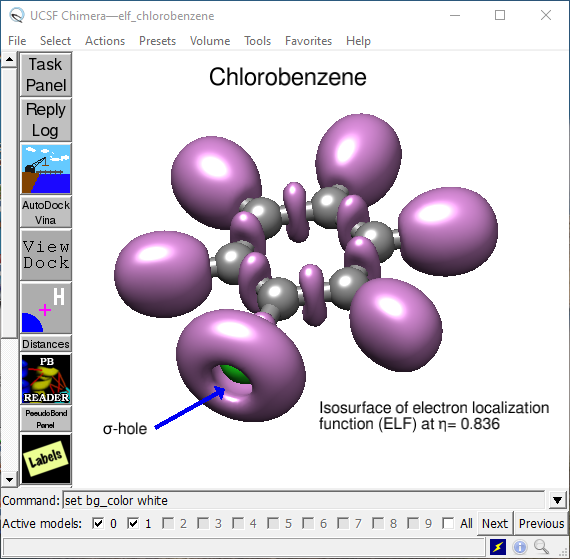
Fig. 5. Electron localization surface (ELF) at η = 0.836 indicating the presence of \(\sigma\)-hole at the chlorine atom in chlorobenzene.
The surface images were generated by the UCSF Chimera package and could be further rendered or improved by the POV-Ray or MeshLab programs.
Next
After the general overview, feature highlights, and several visual examples, the next blog article will focus on practical examples of using Menu options and commands.
Notes
- DeLano, W. L. (2002) The PyMOL Molecular Graphics System, DeLano Scientific LLC, San Carlos, CA ↩
- The PyMOL Molecular Graphics System, Schrödinger, LLC. ↩
- Humphrey, W., Dalke, A., and Schulten, K. (1996) VMD: visual molecular dynamics. J. Mol. Graph. 14, 33–38, 27–28) ↩
- Dassault Systèmes BIOVIA, ver. e.g. 2020, San Diego: Dassault Systèmes. ↩
- Jmol: an open-source Java viewer for chemical structures in 3D. http://www.jmol.org/ ↩
Bibliography
S. F. Altschul, W. Gish, W. Miller, E. W. Myers, and D. J. Lipman. Basic local alignment search tool. J. Mol. Biol., 215(3):403–410, October 1990. doi:10.1016/S0022-2836(05)80360-2. ↩
Todd J. Dolinsky, Paul Czodrowski, Hui Li, Jens E. Nielsen, Jan H. Jensen, Gerhard Klebe, and Nathan A. Baker. PDB2PQR: expanding and upgrading automated preparation of biomolecular structures for molecular simulations. Nucleic Acids Res., 35(Web Server issue):W522–525, July 2007. doi:10.1093/nar/gkm276. ↩
Thomas D Goddard and Thomas E Ferrin. Visualization Software for Molecular Assemblies. Curr Opin Struct Biol, 17(5):587–595, October 2007. doi:10.1016/j.sbi.2007.06.008. ↩
Conrad C. Huang, Elaine C. Meng, John H. Morris, Eric F. Pettersen, and Thomas E. Ferrin. Enhancing UCSF Chimera through web services. Nucleic Acids Res, 42(W1):W478–W484, July 2014. doi:10.1093/nar/gku377. ↩
Eric F. Pettersen, Thomas D. Goddard, Conrad C. Huang, Gregory S. Couch, Daniel M. Greenblatt, Elaine C. Meng, and Thomas E. Ferrin. UCSF Chimera–a visualization system for exploratory research and analysis. J Comput Chem, 25(13):1605–1612, October 2004. doi:10.1002/jcc.20084. ↩
Oleg Trott and Arthur J. Olson. AutoDock Vina: improving the speed and accuracy of docking with a new scoring function, efficient optimization, and multithreading. J Comput Chem, 31(2):455–461, January 2010. doi:10.1002/jcc.21334. ↩
Samir Unni, Yong Huang, Robert M. Hanson, Malcolm Tobias, Sriram Krishnan, Wilfred W. Li, Jens E. Nielsen, and Nathan A. Baker. Web servers and services for electrostatics calculations with APBS and PDB2PQR. J Comput Chem, 32(7):1488–1491, May 2011. doi:10.1002/jcc.21720. ↩ 1 2
Benjamin Webb and Andrej Sali. Comparative Protein Structure Modeling Using MODELLER. Curr Protoc Bioinformatics, 54:5.6.1–5.6.37, June 2016. doi:10.1002/cpbi.3. ↩
Zheng Yang, Keren Lasker, Dina Schneidman-Duhovny, Ben Webb, Conrad C. Huang, Eric F. Pettersen, Thomas D. Goddard, Elaine C. Meng, Andrej Sali, and Thomas E. Ferrin. UCSF Chimera, MODELLER, and IMP: An integrated modeling system. Journal of Structural Biology, 179(3):269–278, September 2012. doi:10.1016/j.jsb.2011.09.006. ↩
Dina Schneidman-Duhovny, Michal Hammel, and Andrej Sali. FoXS: a web server for rapid computation and fitting of SAXS profiles. Nucleic Acids Res., 38(Web Server issue):W540–544, July 2010. doi:10.1093/nar/gkq461. ↩
Comments
comments powered by Disqus